Simulation and reporting of water levels
Introduction
Within LISFLOOD it is possible to simulate and report water levels in the river channel. This page describes the LISFLOOD water levels option, and how it is used. The simulation of water levels is optional, and it can be activated by adding the following line to the ‘lfoptions’ element:
<setoption name="simulateWaterLevels" choice="1" />
If the option is switched on, water levels are calculated for river channel pixels where flow routing is computed. Using this option does not influence the actual model results in any way, and it is included only to allow the model user to report water levels. The actual reporting of the simulated water levels (as time series or maps) can be activated using two separate options (see below in section ‘Reporting of water levels’):
Calculation of water levels
When using the kinematic solution of the Saint Venant Equations, only approximate water levels can be estimated from the cross-sectional (wetted) channel area, $A_{ch}$ for each time step. Since the channel cross-section is described as a trapezoid, water levels follow directly from $A_{ch}$ , channel bottom width, side slope and bankfull level. If $A_{ch}$ exceeds the bankfull cross-sectional area ($A_{bf}$), the surplus is distributed evenly over the (rectangular) floodplain, and the depth of water on the floodplain is added to the (bankfull) channel depth. The Figure below further illustrates the cross-section geometry. All water levels are relative to channel bottom level ($z_{bot}$ in the Figure).
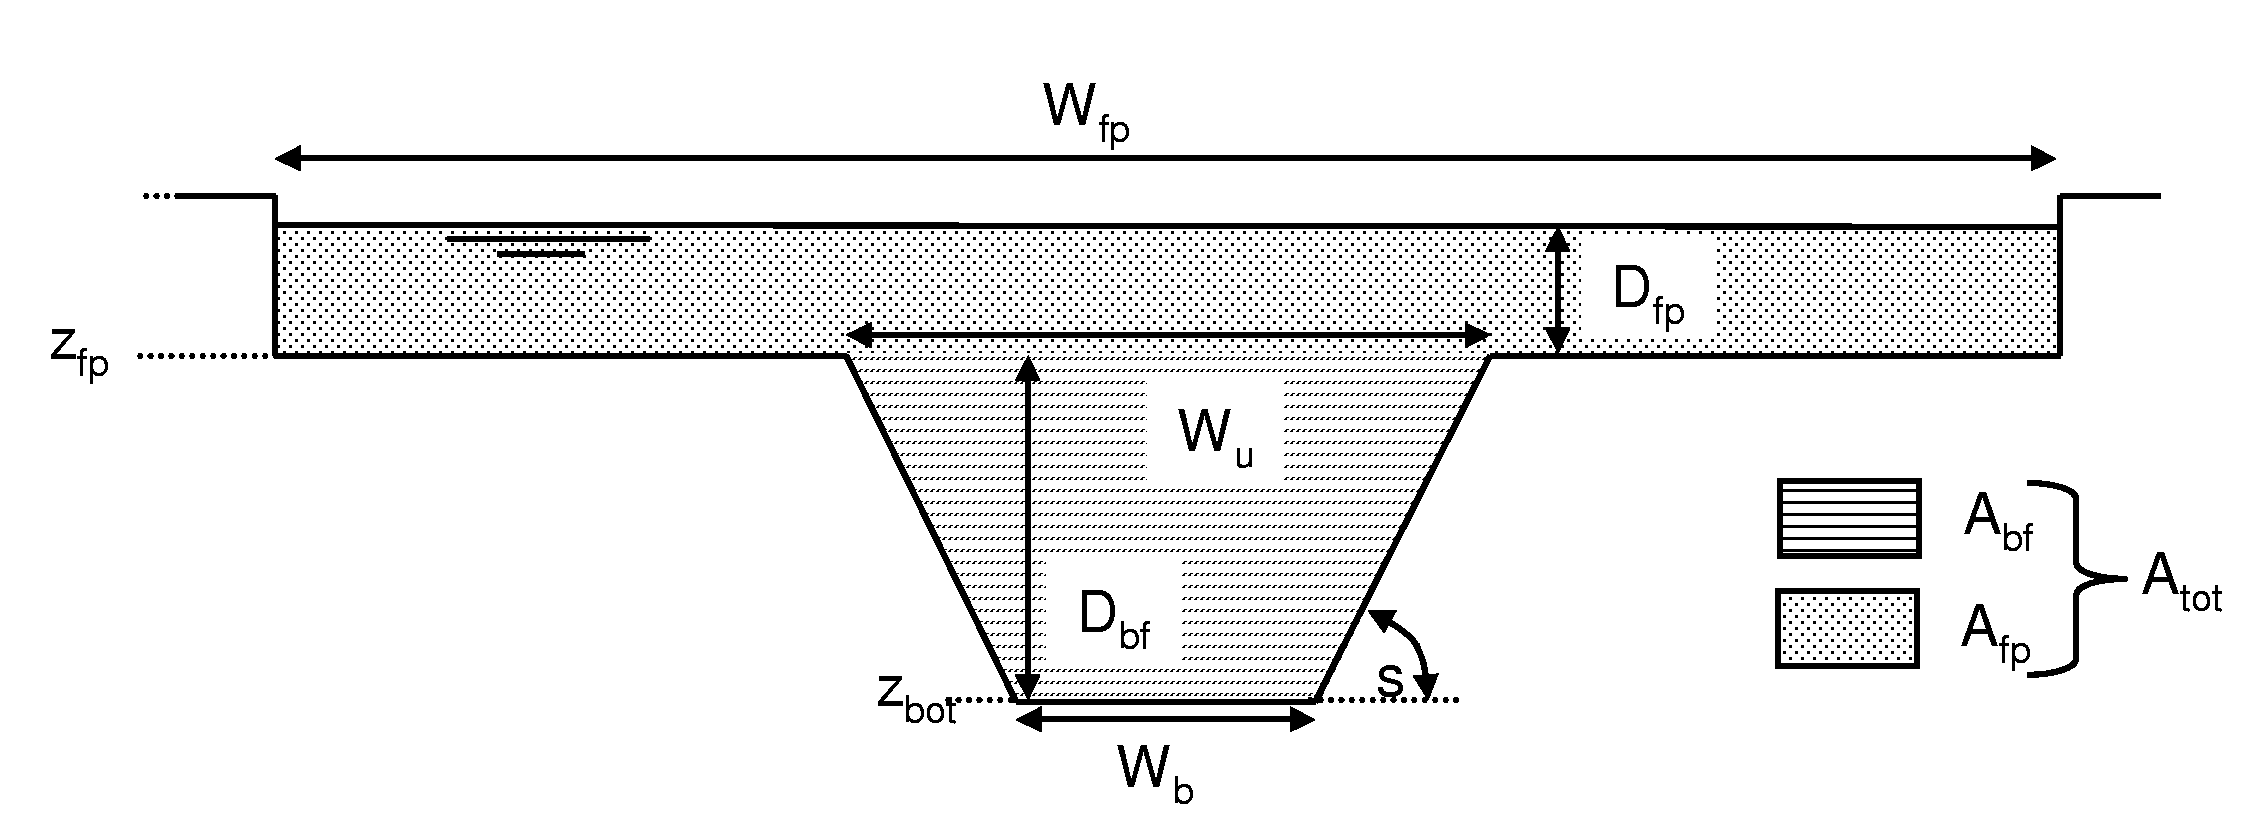 Figure: Geometry of channel cross-section in kinematic wave routing. With $W_b$: channel bottom width; $W_u$: channel upper width; $z_{bot}$: channel bottom level; $z_{fp}$: floodplain bottom level; $s$: channel side slope; $W_{fp}$: floodplain width; $A_{bf}$: channel cross-sectional area at bankfull; $A_{fp}$: floodplain cross-sectional area; $D_{bf}$: bankfull channel depth, $D_{fp}$: depth of water in the floodplain.
In order to calculate water levels, LISFLOOD needs a map with the width of the floodplain in [m], which is defined by ‘lfbinding’ variable FloodPlainWidth (the default name of this map is chanfpln.map).
Note that for channel stretches that are simulated using the dynamic solution of the Saint Venant Equations the water level in the channel is simply the difference between the channel head and the channel bottom level.
Reporting of water levels
Water levels can be reported as time series (at the gauge locations that are also used for reporting discharge), or as maps.
To generate a time series, add the following line to the ‘lfoptions’ element of your settings file:
<setoption name="repWaterLevelTs" choice="1" />
For maps, use the following line instead:
<setoption name="repWaterLevelMaps" choice="1" />
In either case, the reporting options should be used in addition to the ‘simulateWaterLevels’ option. If you do not include the ‘simulateWaterLevels’ option, there will be nothing to report and LISFLOOD will exit with an error message.
Preparation of settings file
The naming of the reported water level time series and maps is defined in the settings file. If you are using a default LISFLOOD settings template, all file definitions are already defined in the ‘lfbinding’ element.
Time series:
	<textvar name="WaterLevelTS" value="$(PathOut)/waterLevel.tss">
	<comment>
	Reported water level [m]
	</comment>
	</textvar>
Map stack:
	<textvar name="WaterLevelMaps" value="$(PathOut)/wl">
	<comment>
	Reported water level [m]
	</comment>
	</textvar>