Rice calendar
Rice is the world’s most important food crop. It is harvested from over 163 million hectares in more than 100 countries (FAO). It is grown in diverse cropping systems and environments - from single crop systems in temperate and tropical regions in both rainfed and irrigated conditions, to intensive monoculture in irrigated areas in the tropics where rice is grown two or three times per year (Laborte et al, 2017). Rice fields strongly differ from other crop fields in water routing, so hydrological models (e.g. LISFLOOD) have a separate component that computes necessary parameters over the rice fields.
General map information and possible source data
| Map name | File name;type | Units; range | Description |
|---|---|---|---|
| Rice planting day | riceplantingdayN.nc; Float32 | Units: calendar day number; Range: 1 ..365 |
Map with first/second rice season planting day |
| Rice harvest day | riceharvestdayN.nc; Float32 | Units: calendar day number; Range: 1 ..365 |
Map with first/second rice season harvesting day |
*where N is the number of season (N = ’1’ for first season, N = ’2’ for second season). With source data below it is possible to generate N = ’3’ third season.
| Source data | Reference/preparation | Temporal coverage | Spatial information |
|---|---|---|---|
| RiceAtlas, a global database of rice calendars and production; Version 3 |
RiceAtlas | up to 2017 | Global, shapefiles |
Methodology
For the rice calendar maps, the ‘country subdivision’ shapefiles and ‘rice production’ table from RiceAtlas can be used. The ‘rice production’ table provides the following information: ‘peak’ planting days (named as PLANT_PK1, PLANT_PK2, PLANT_PK3), ‘peak’ harvest days (named as HARV_PK1, HARV_PK2, HARV_PK3), and number of rice total seasons per year (named as NUM_CROP), seasons varying from 1 (minimum) to 3 (maximum).
The rice seasons are ordered according to the plant starting date in increasing Julian day order (i.e. season 1 being the one starting the earliest in the calendar year).
Then, the rice planting and harvesting fields for season 1 and 2 are created based on the ordered seasons. If there is only one season then its dates are copied to season 2. To insure the absence of missing data, a fixed value of rice planting/harvesting is associated with each grid-cell corresponding to nil rice fraction as the pre-computed global mode.unweighted() values of the first rice season – here planting date equals 105, harvesting date equals 227.
Results (examples)
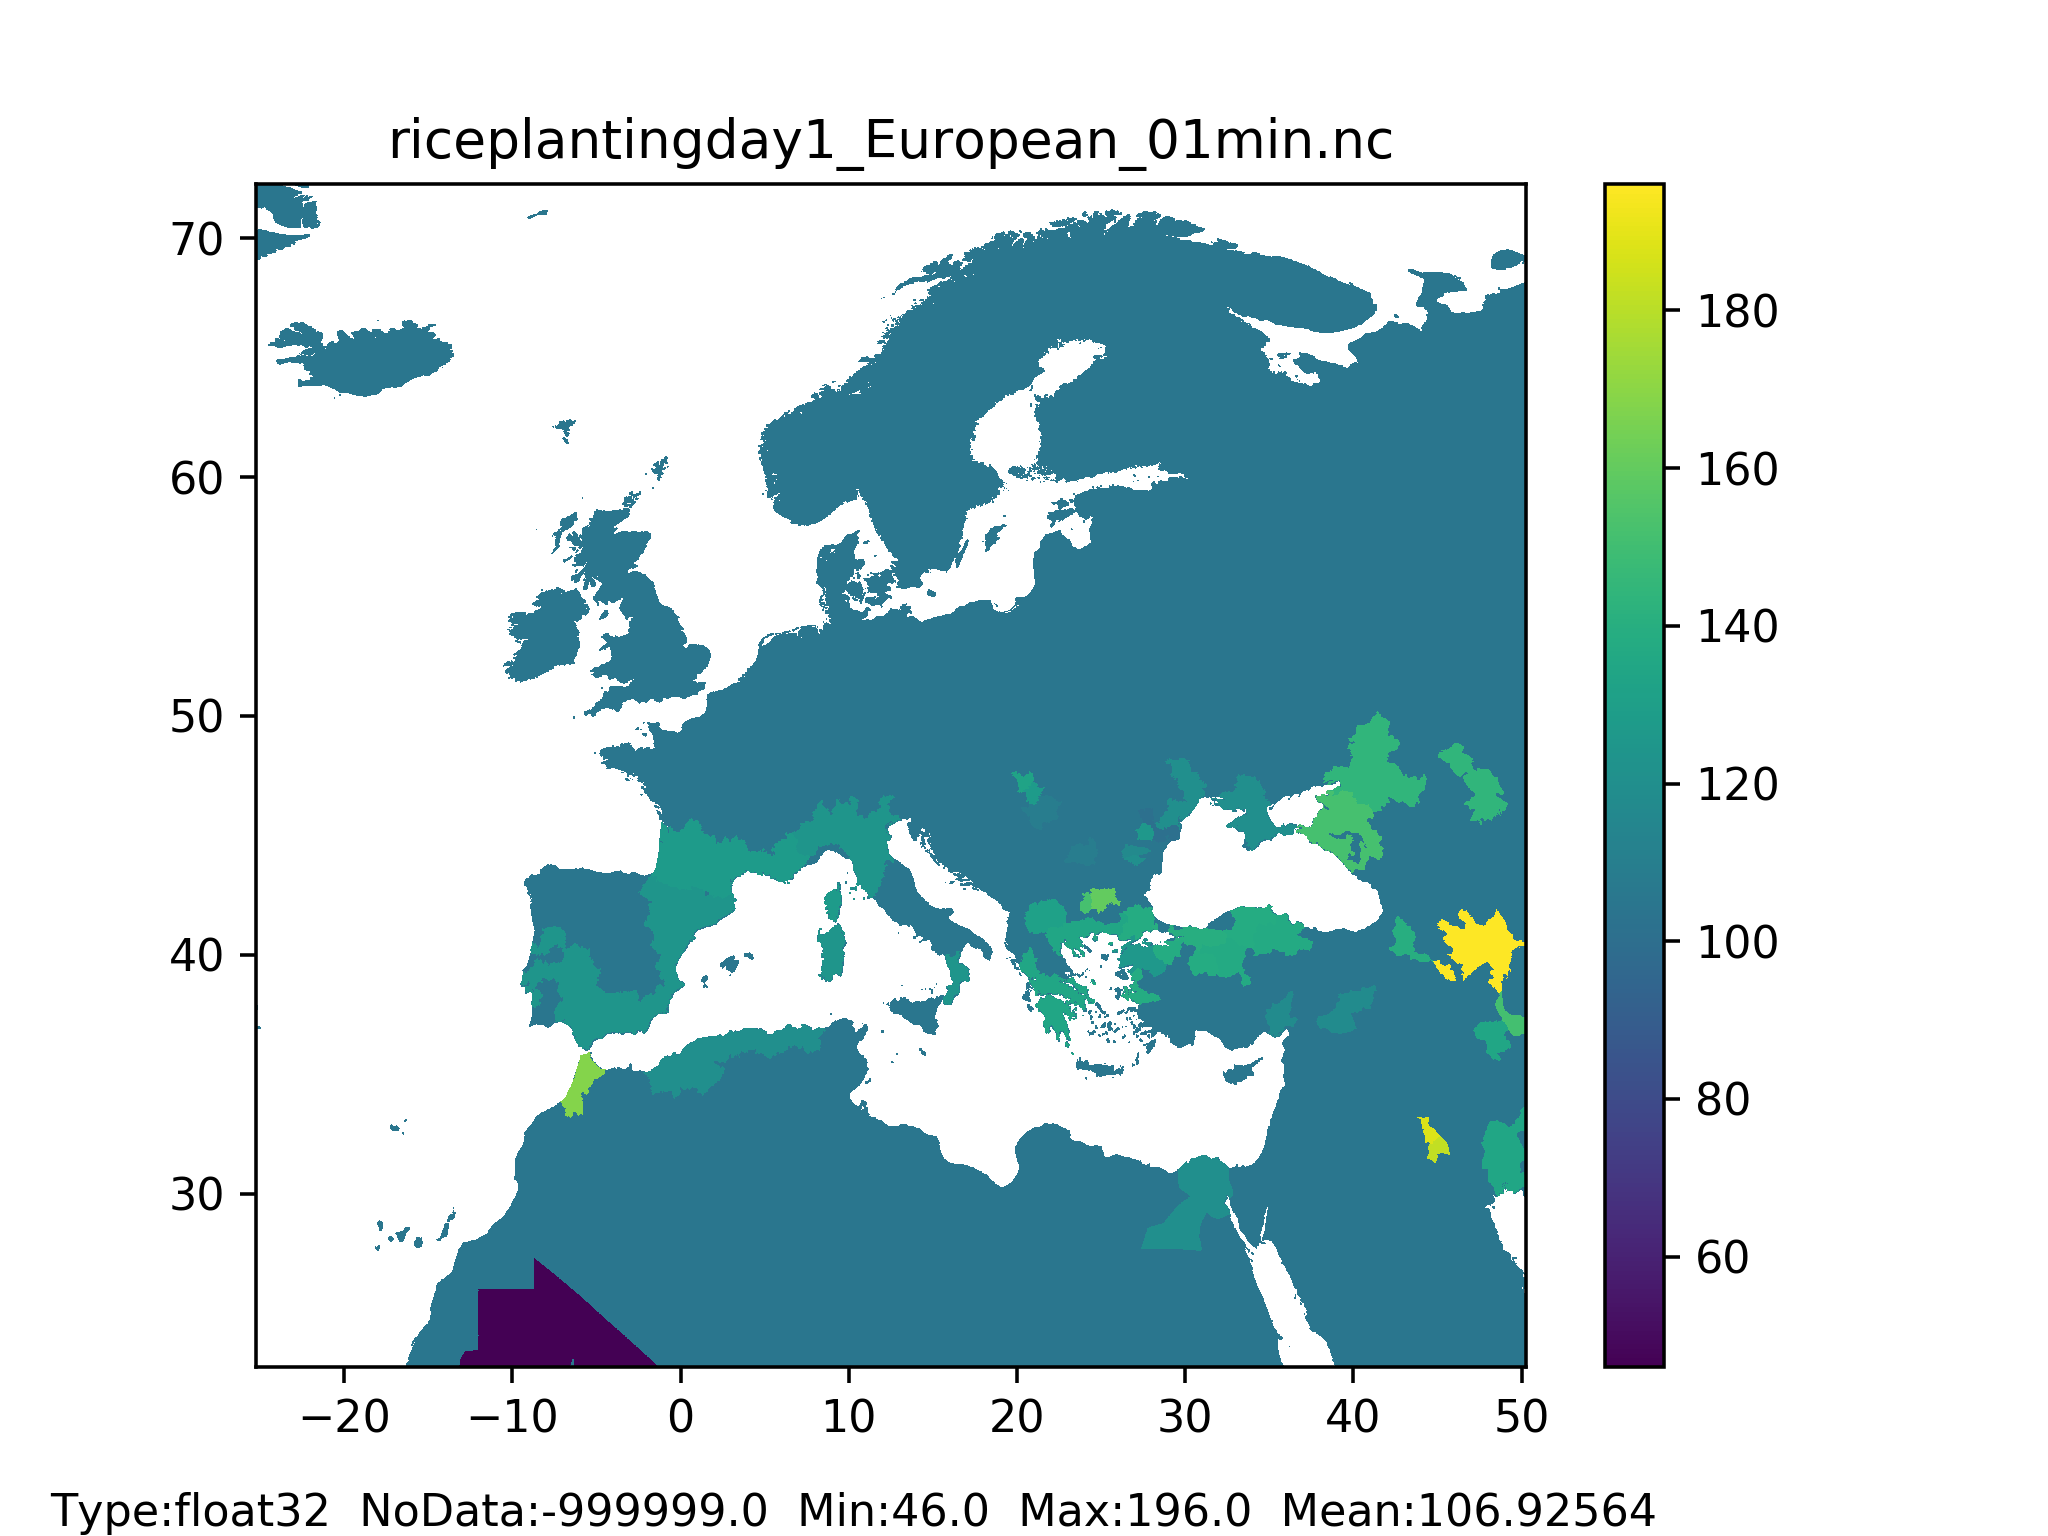
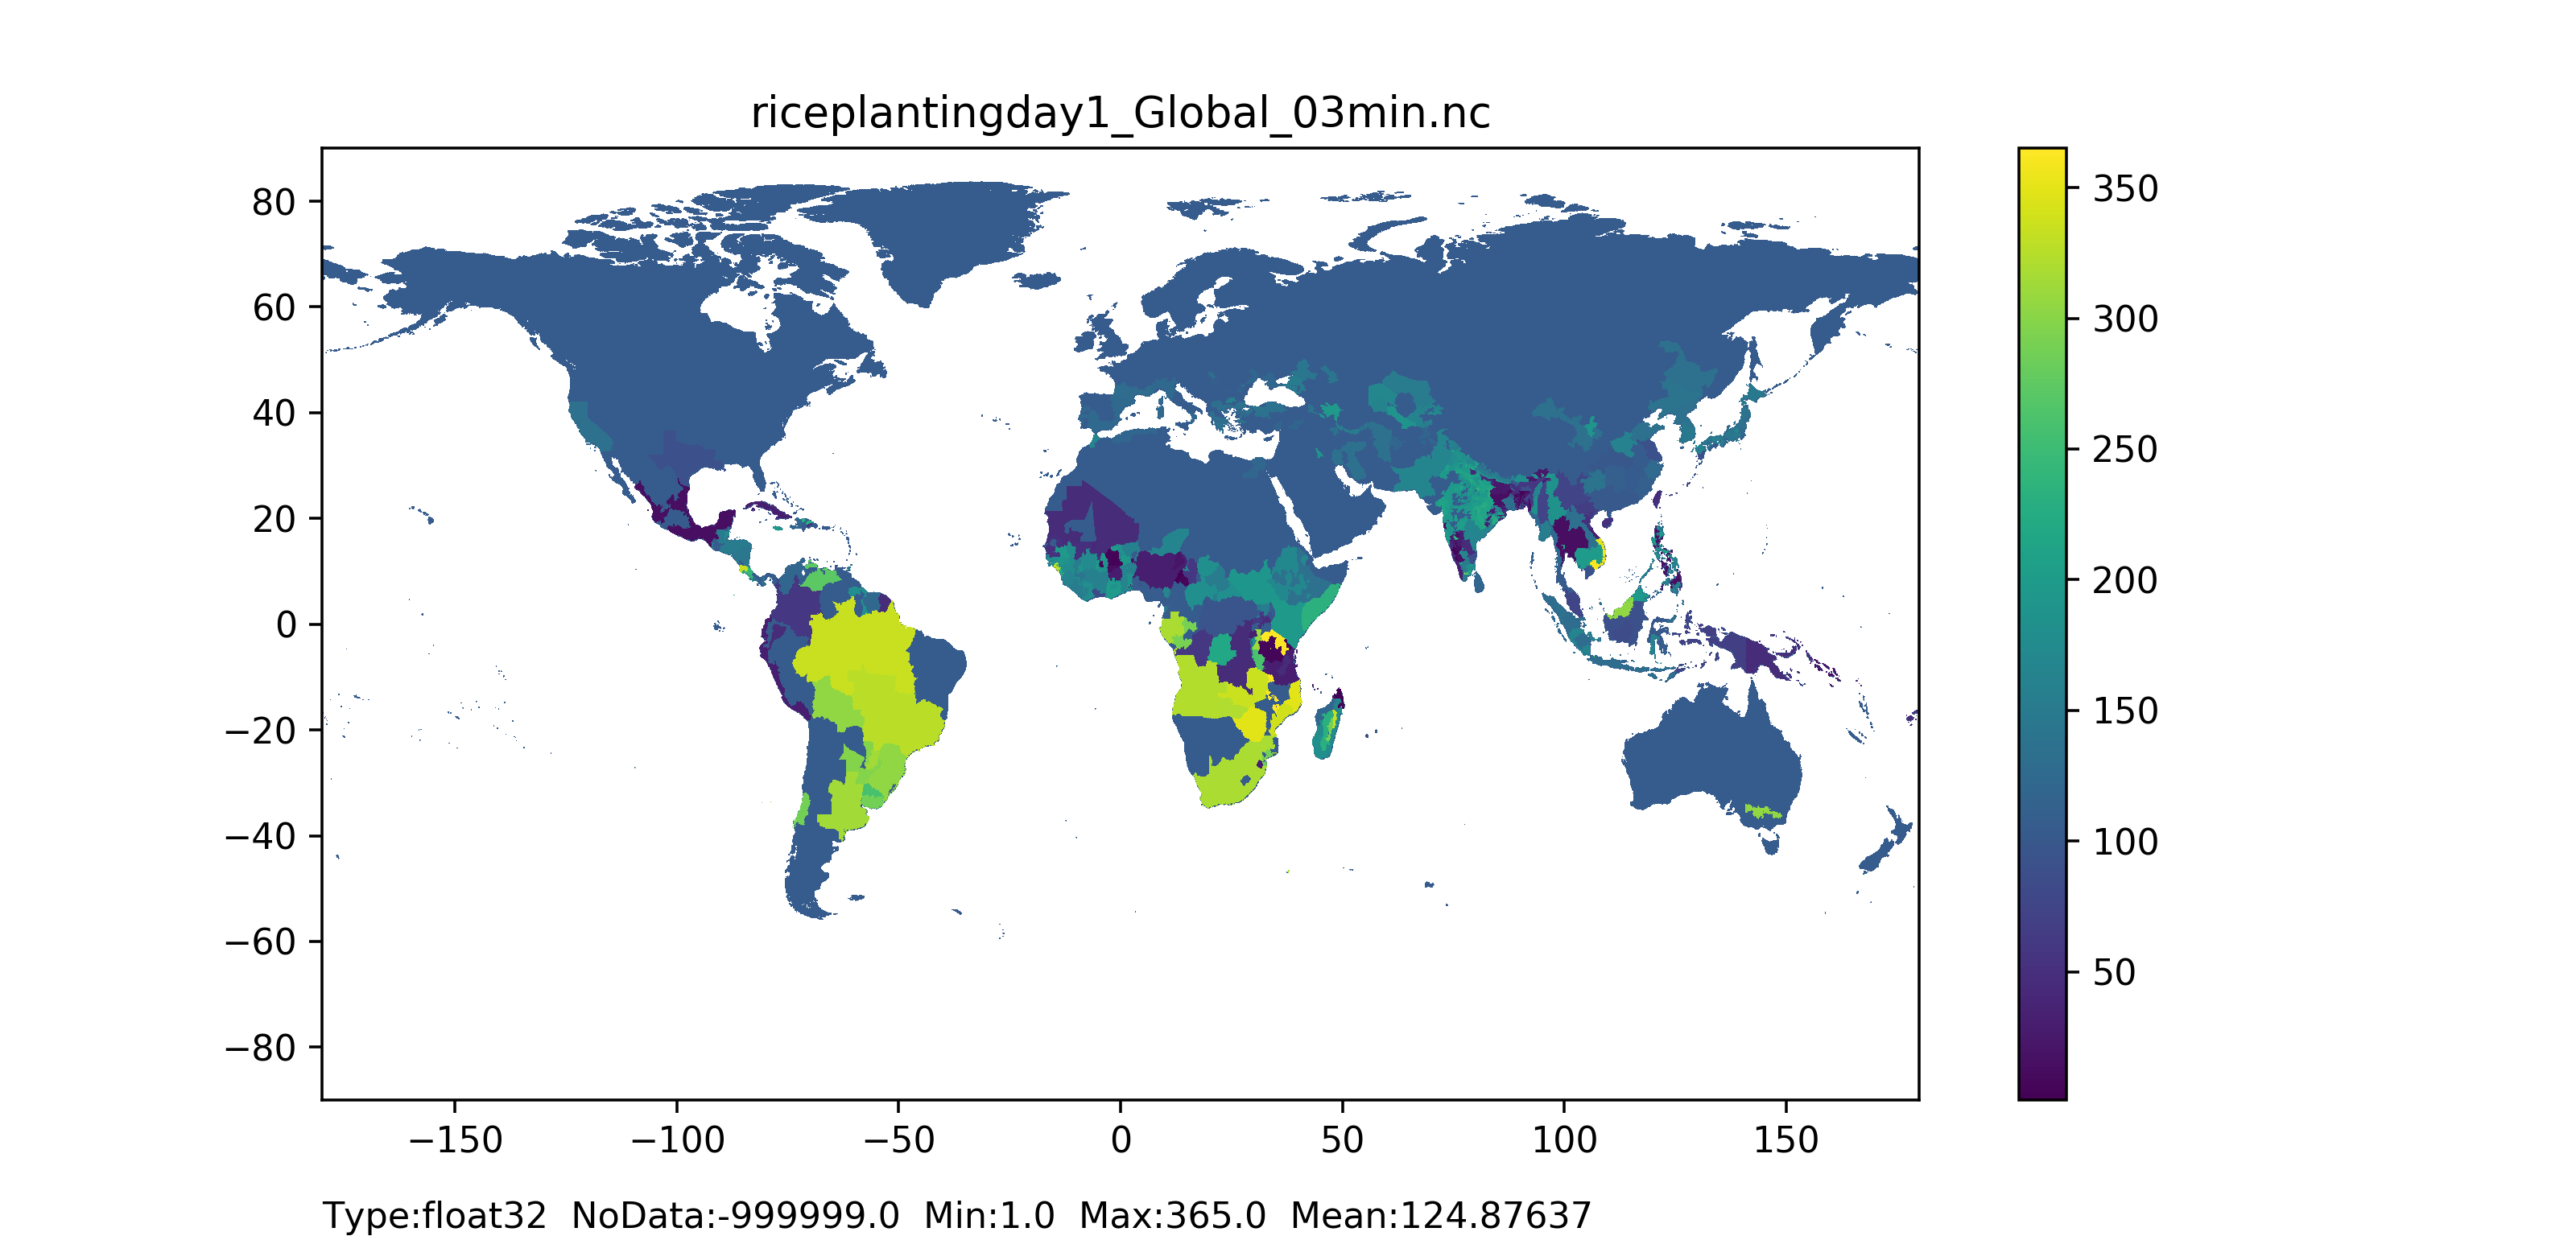
Figure 54: Rice planting day 1 (season 1) map at 1 arc min horizontal resolution for European domain (left) and at 3 arc min horizontal resolution for Global domain (right).
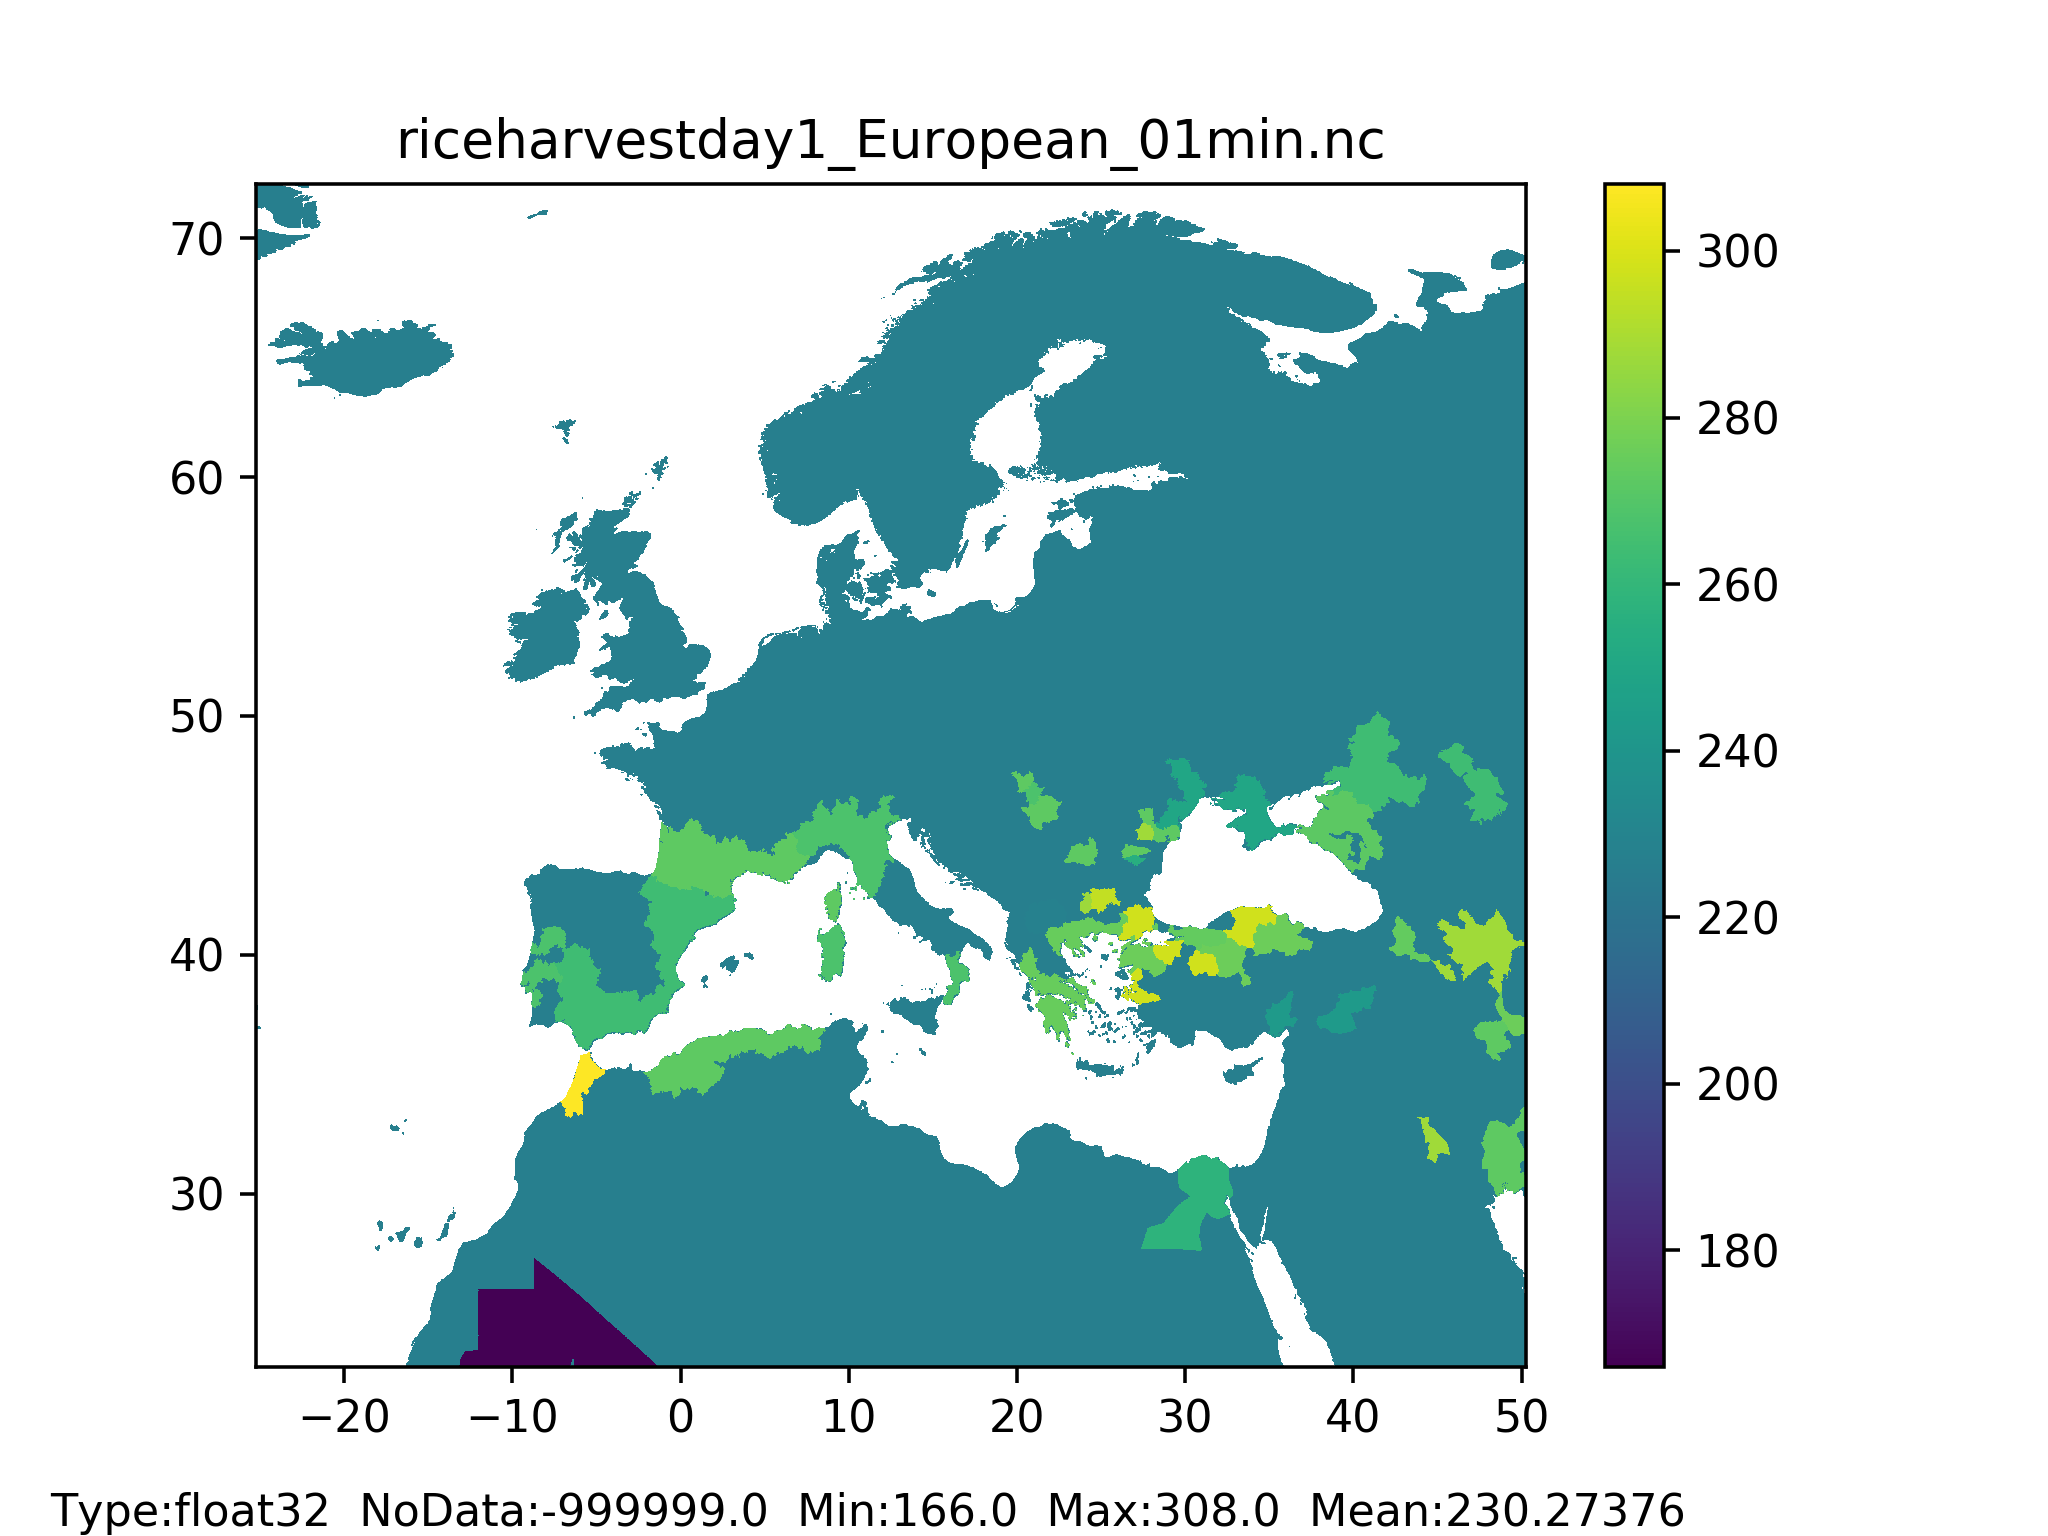
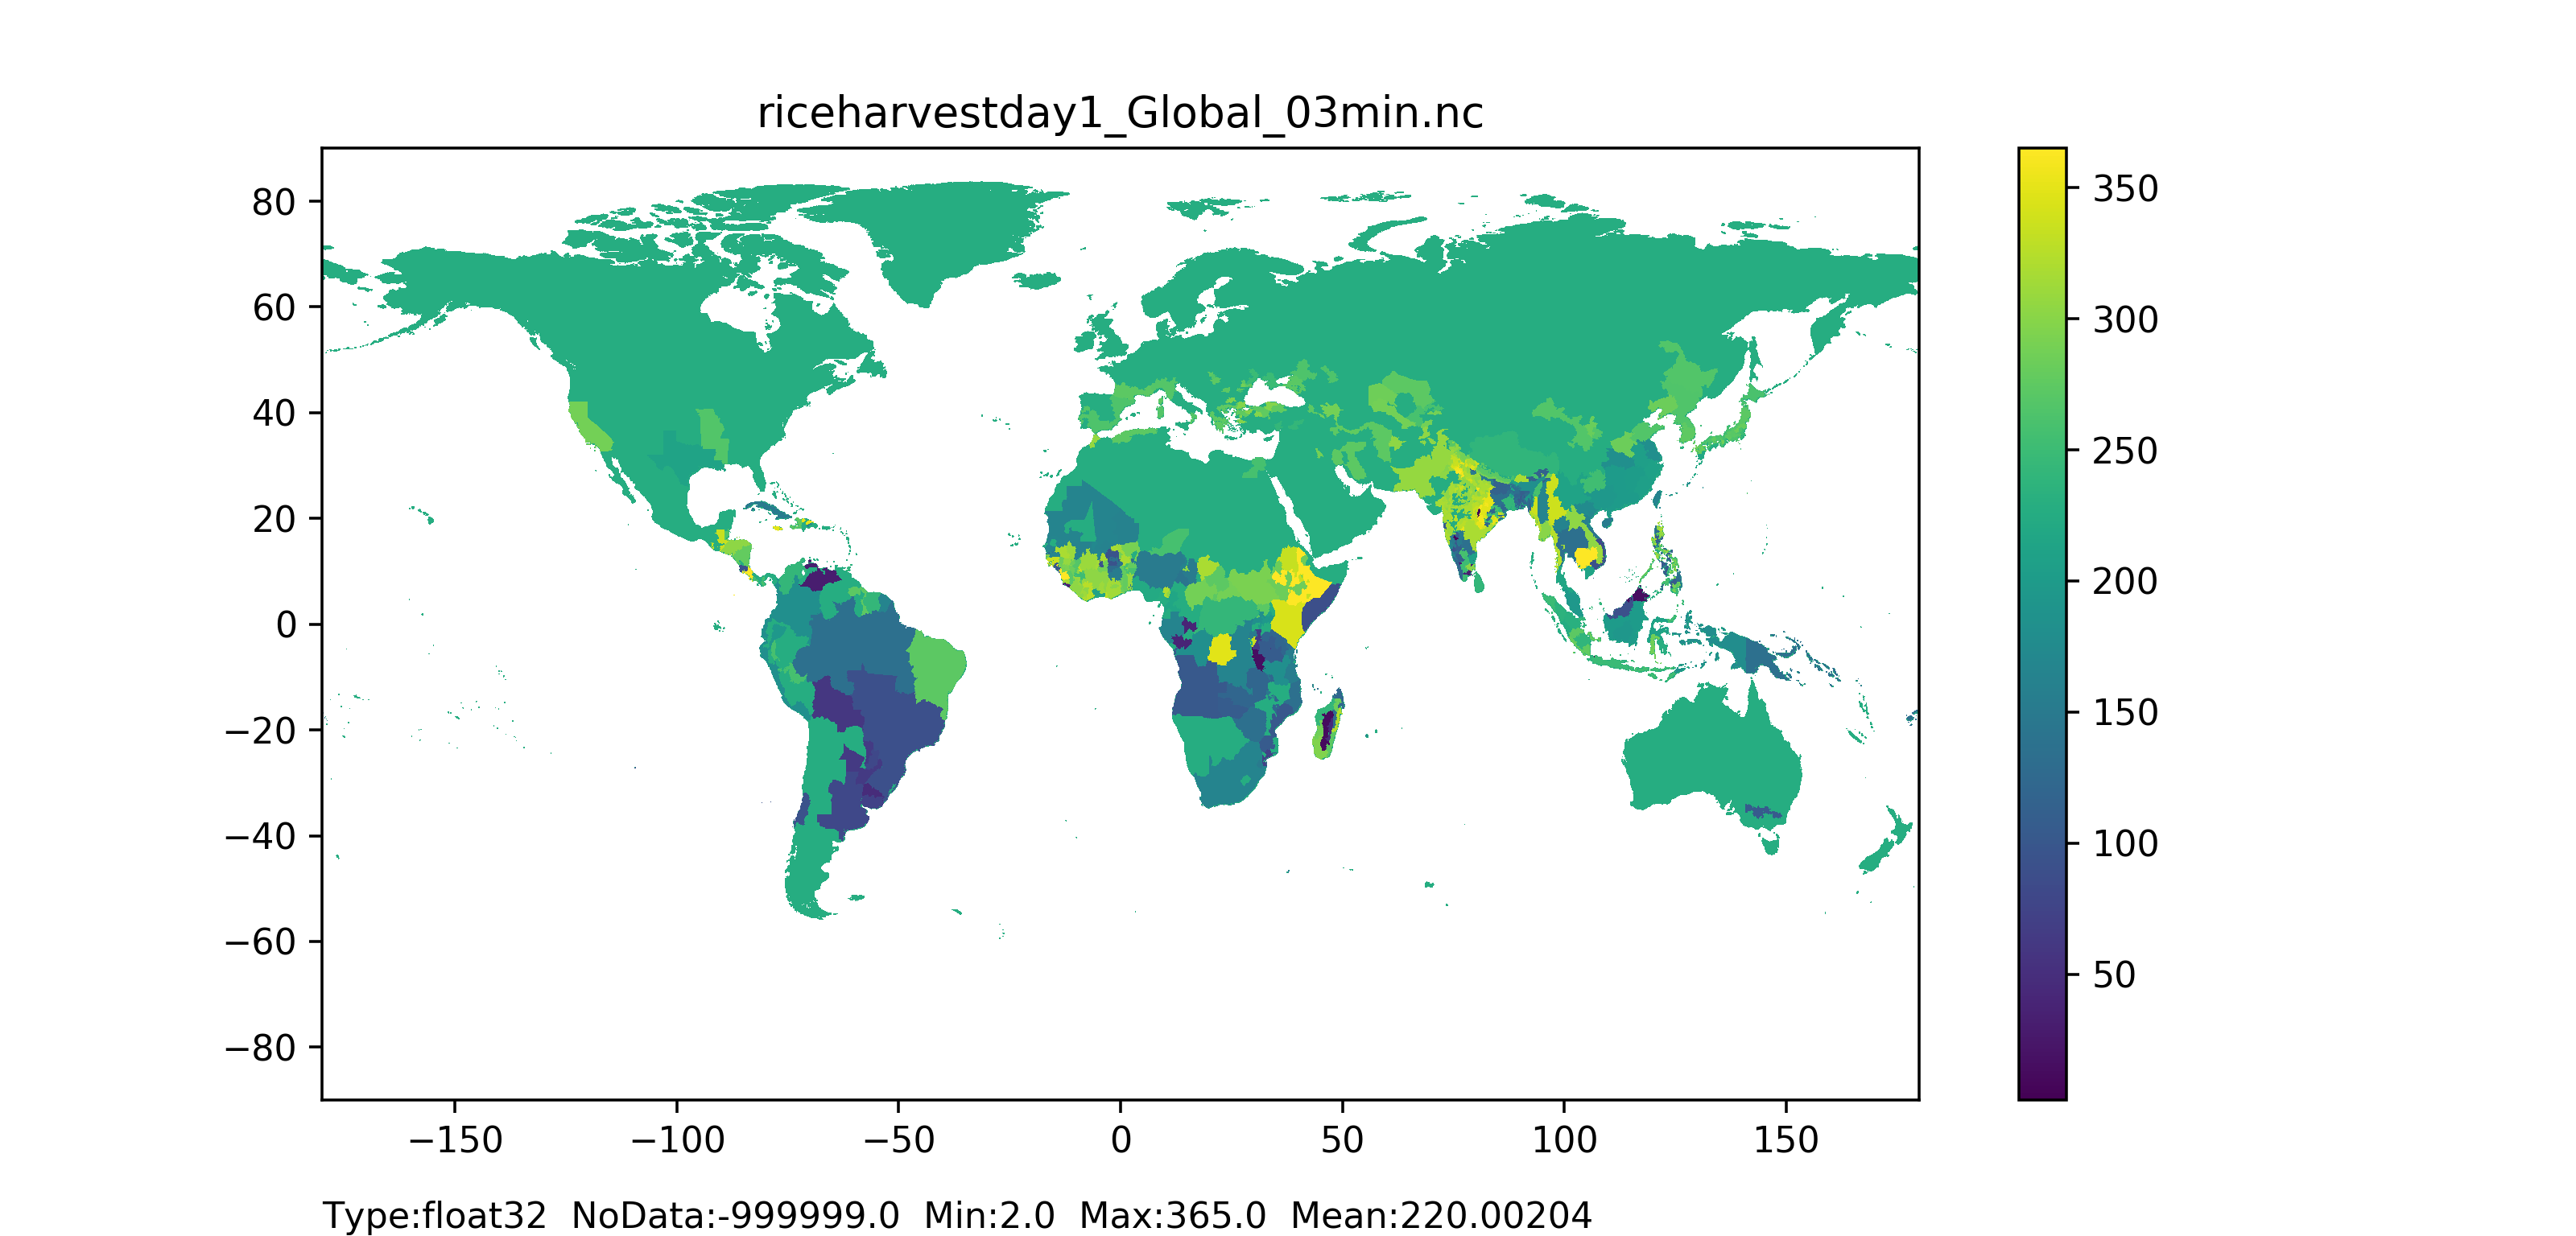
Figure 55: Rice harvest day 1 (season 1) map at 1 arc min horizontal resolution for European domain (left) and at 3 arc min horizontal resolution for Global domain (right).
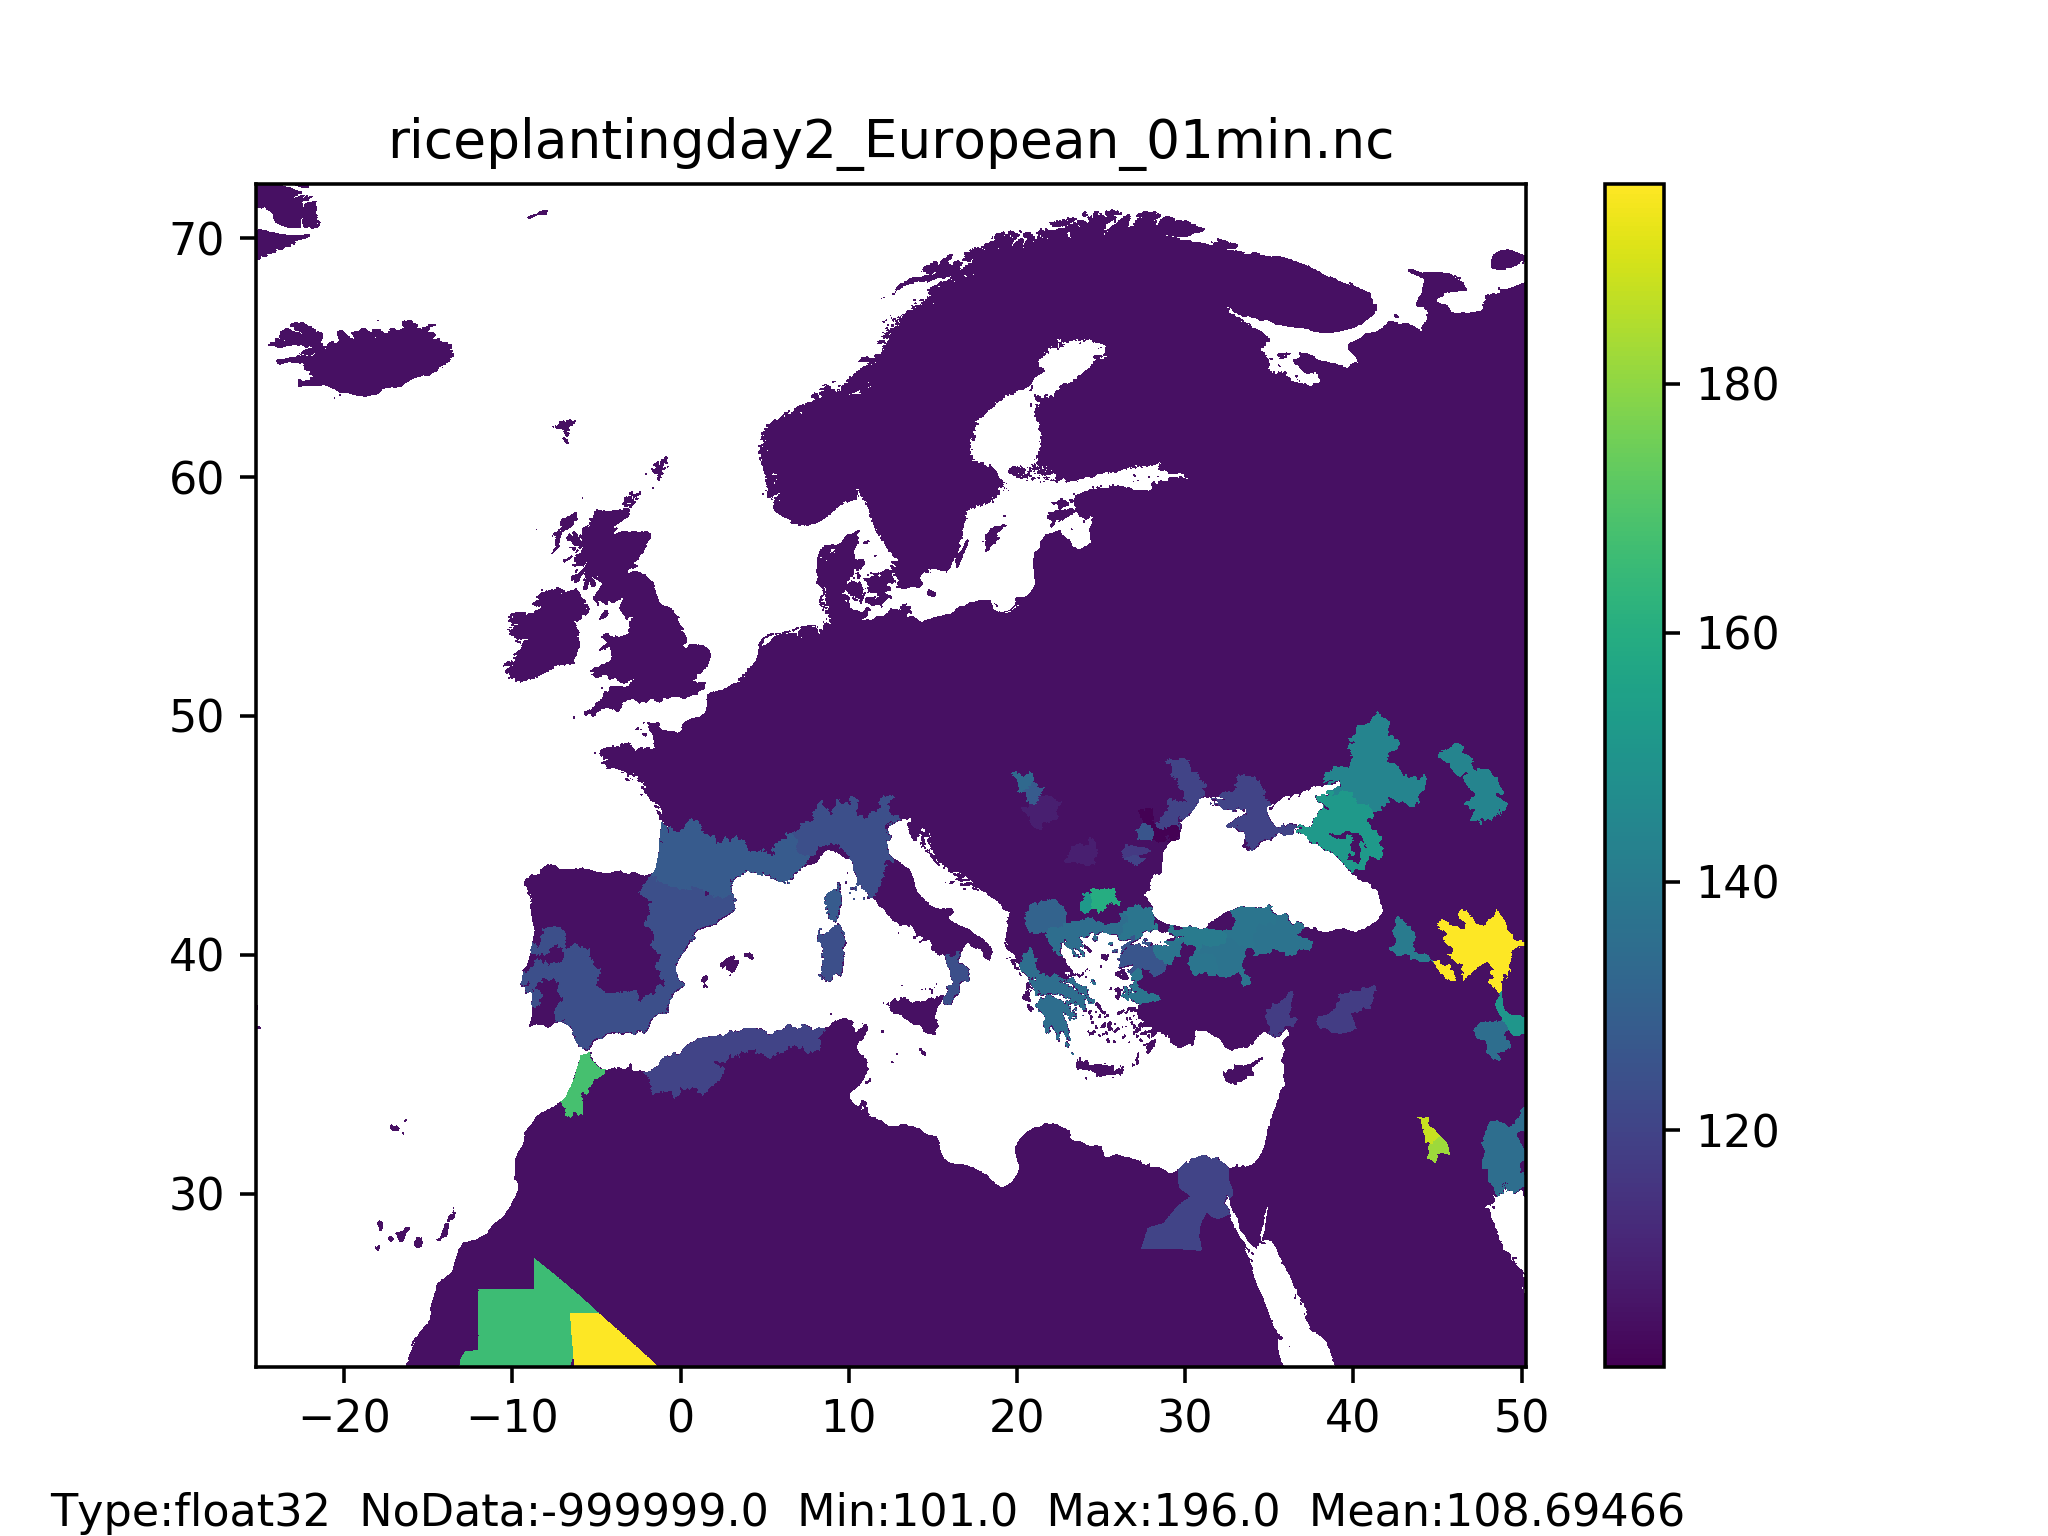
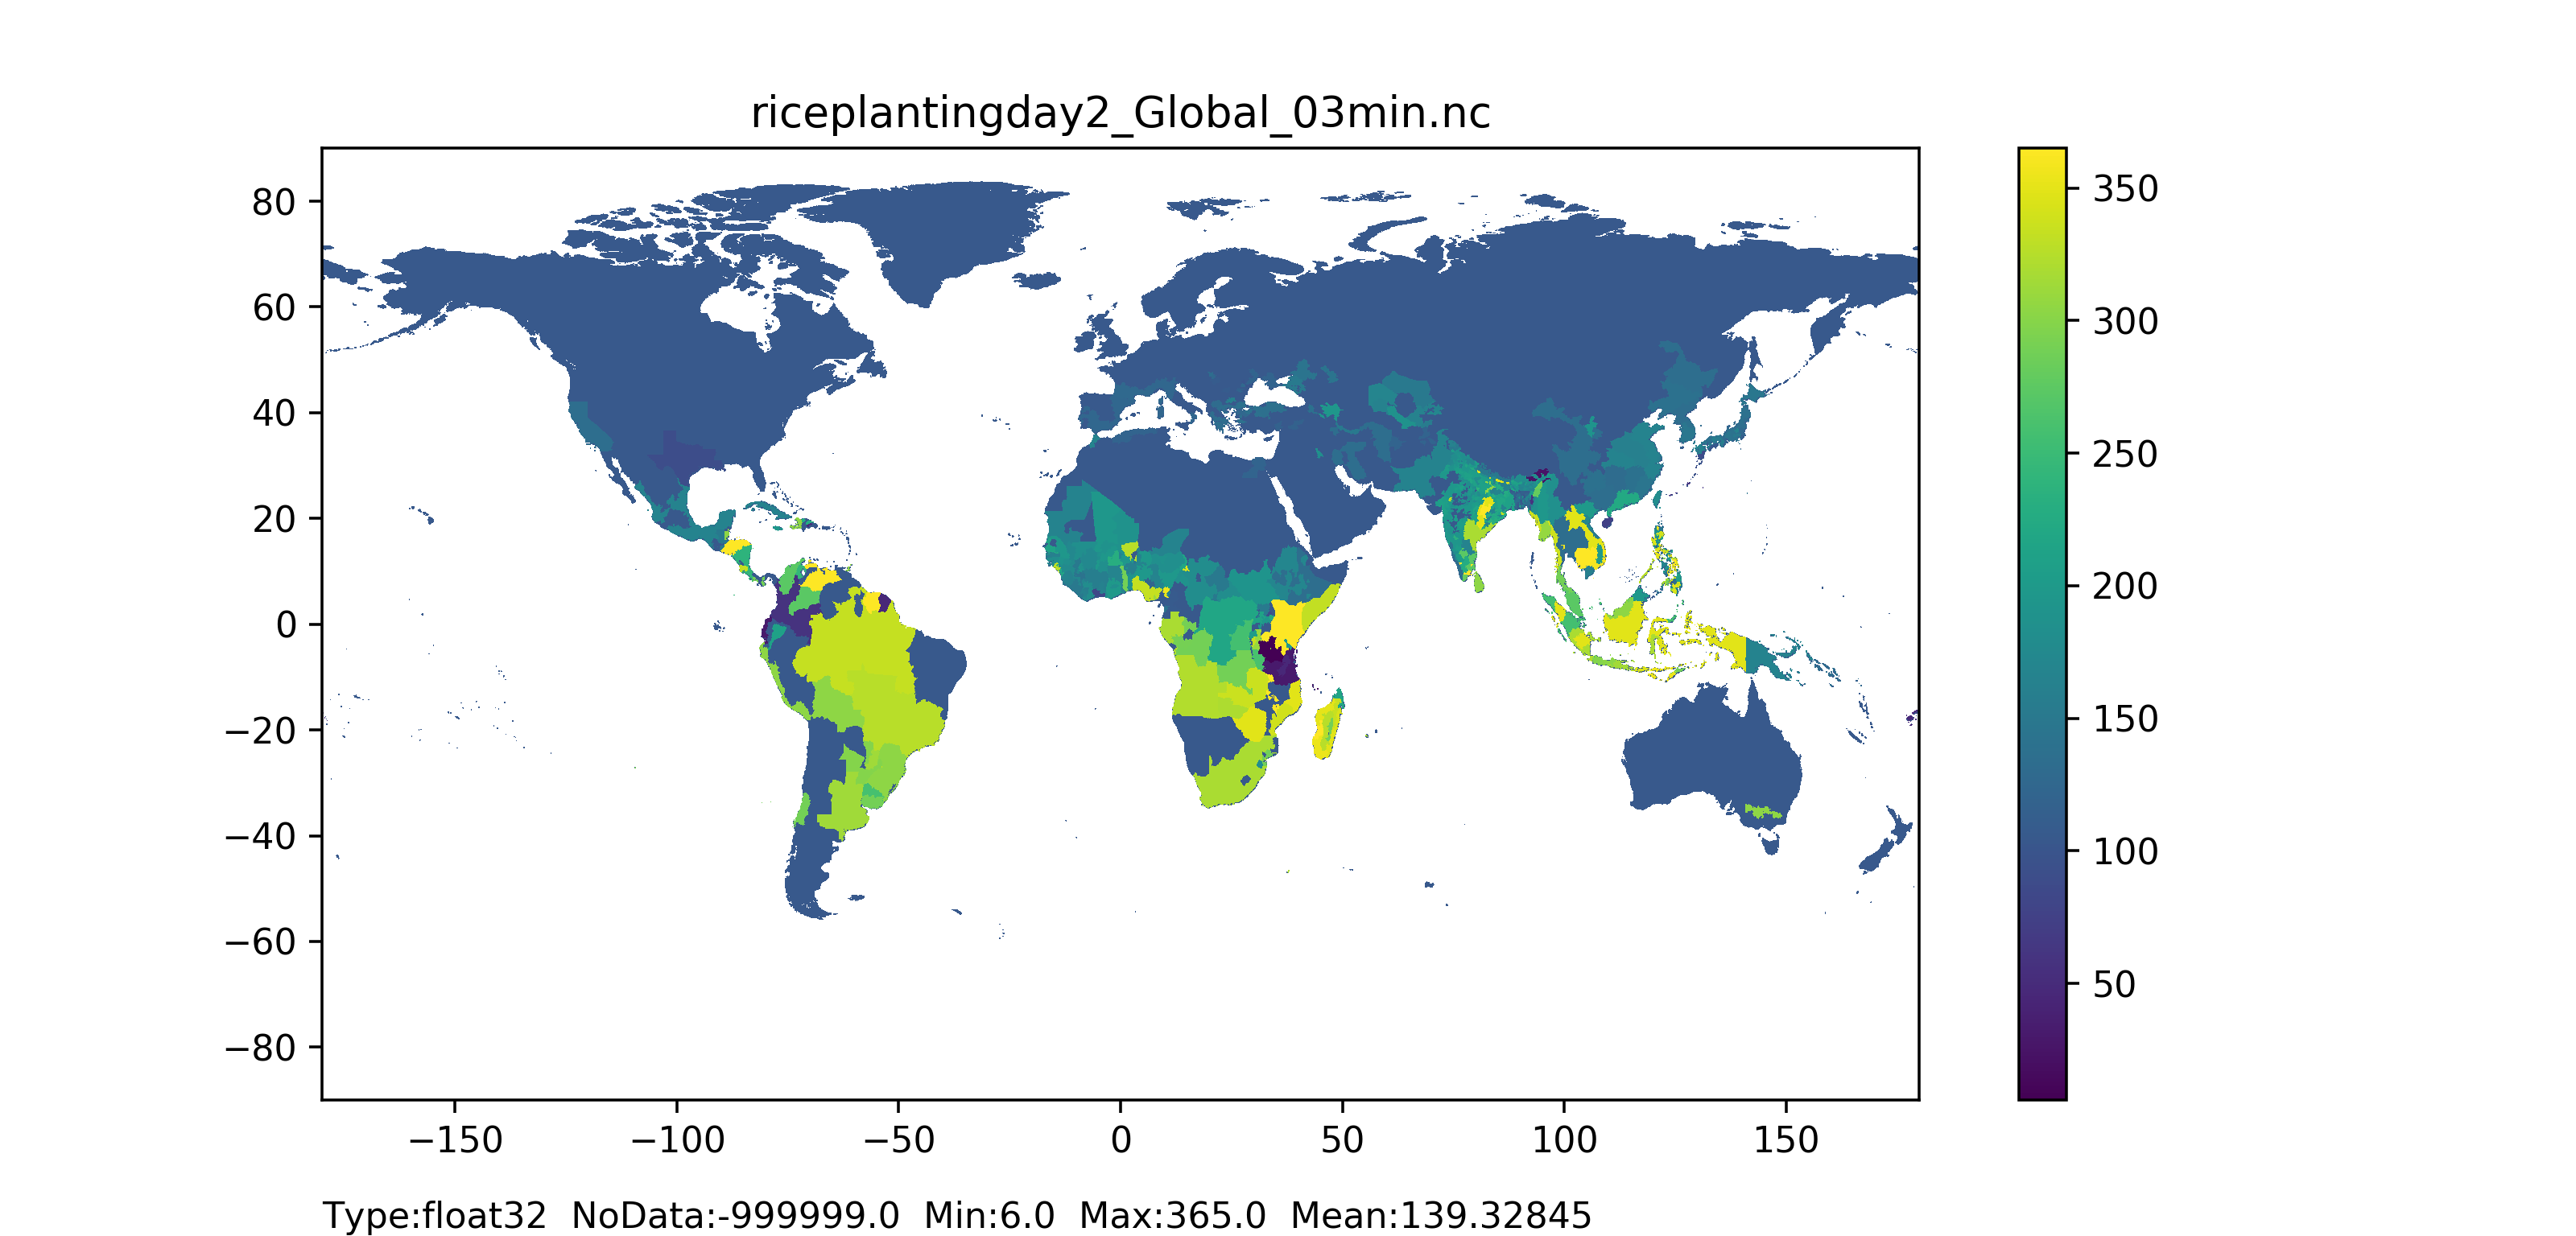
Figure 55: Rice planting day 2 (season 2) map at 1 arc min horizontal resolution for European domain (left) and at 3 arc min horizontal resolution for Global domain (right).
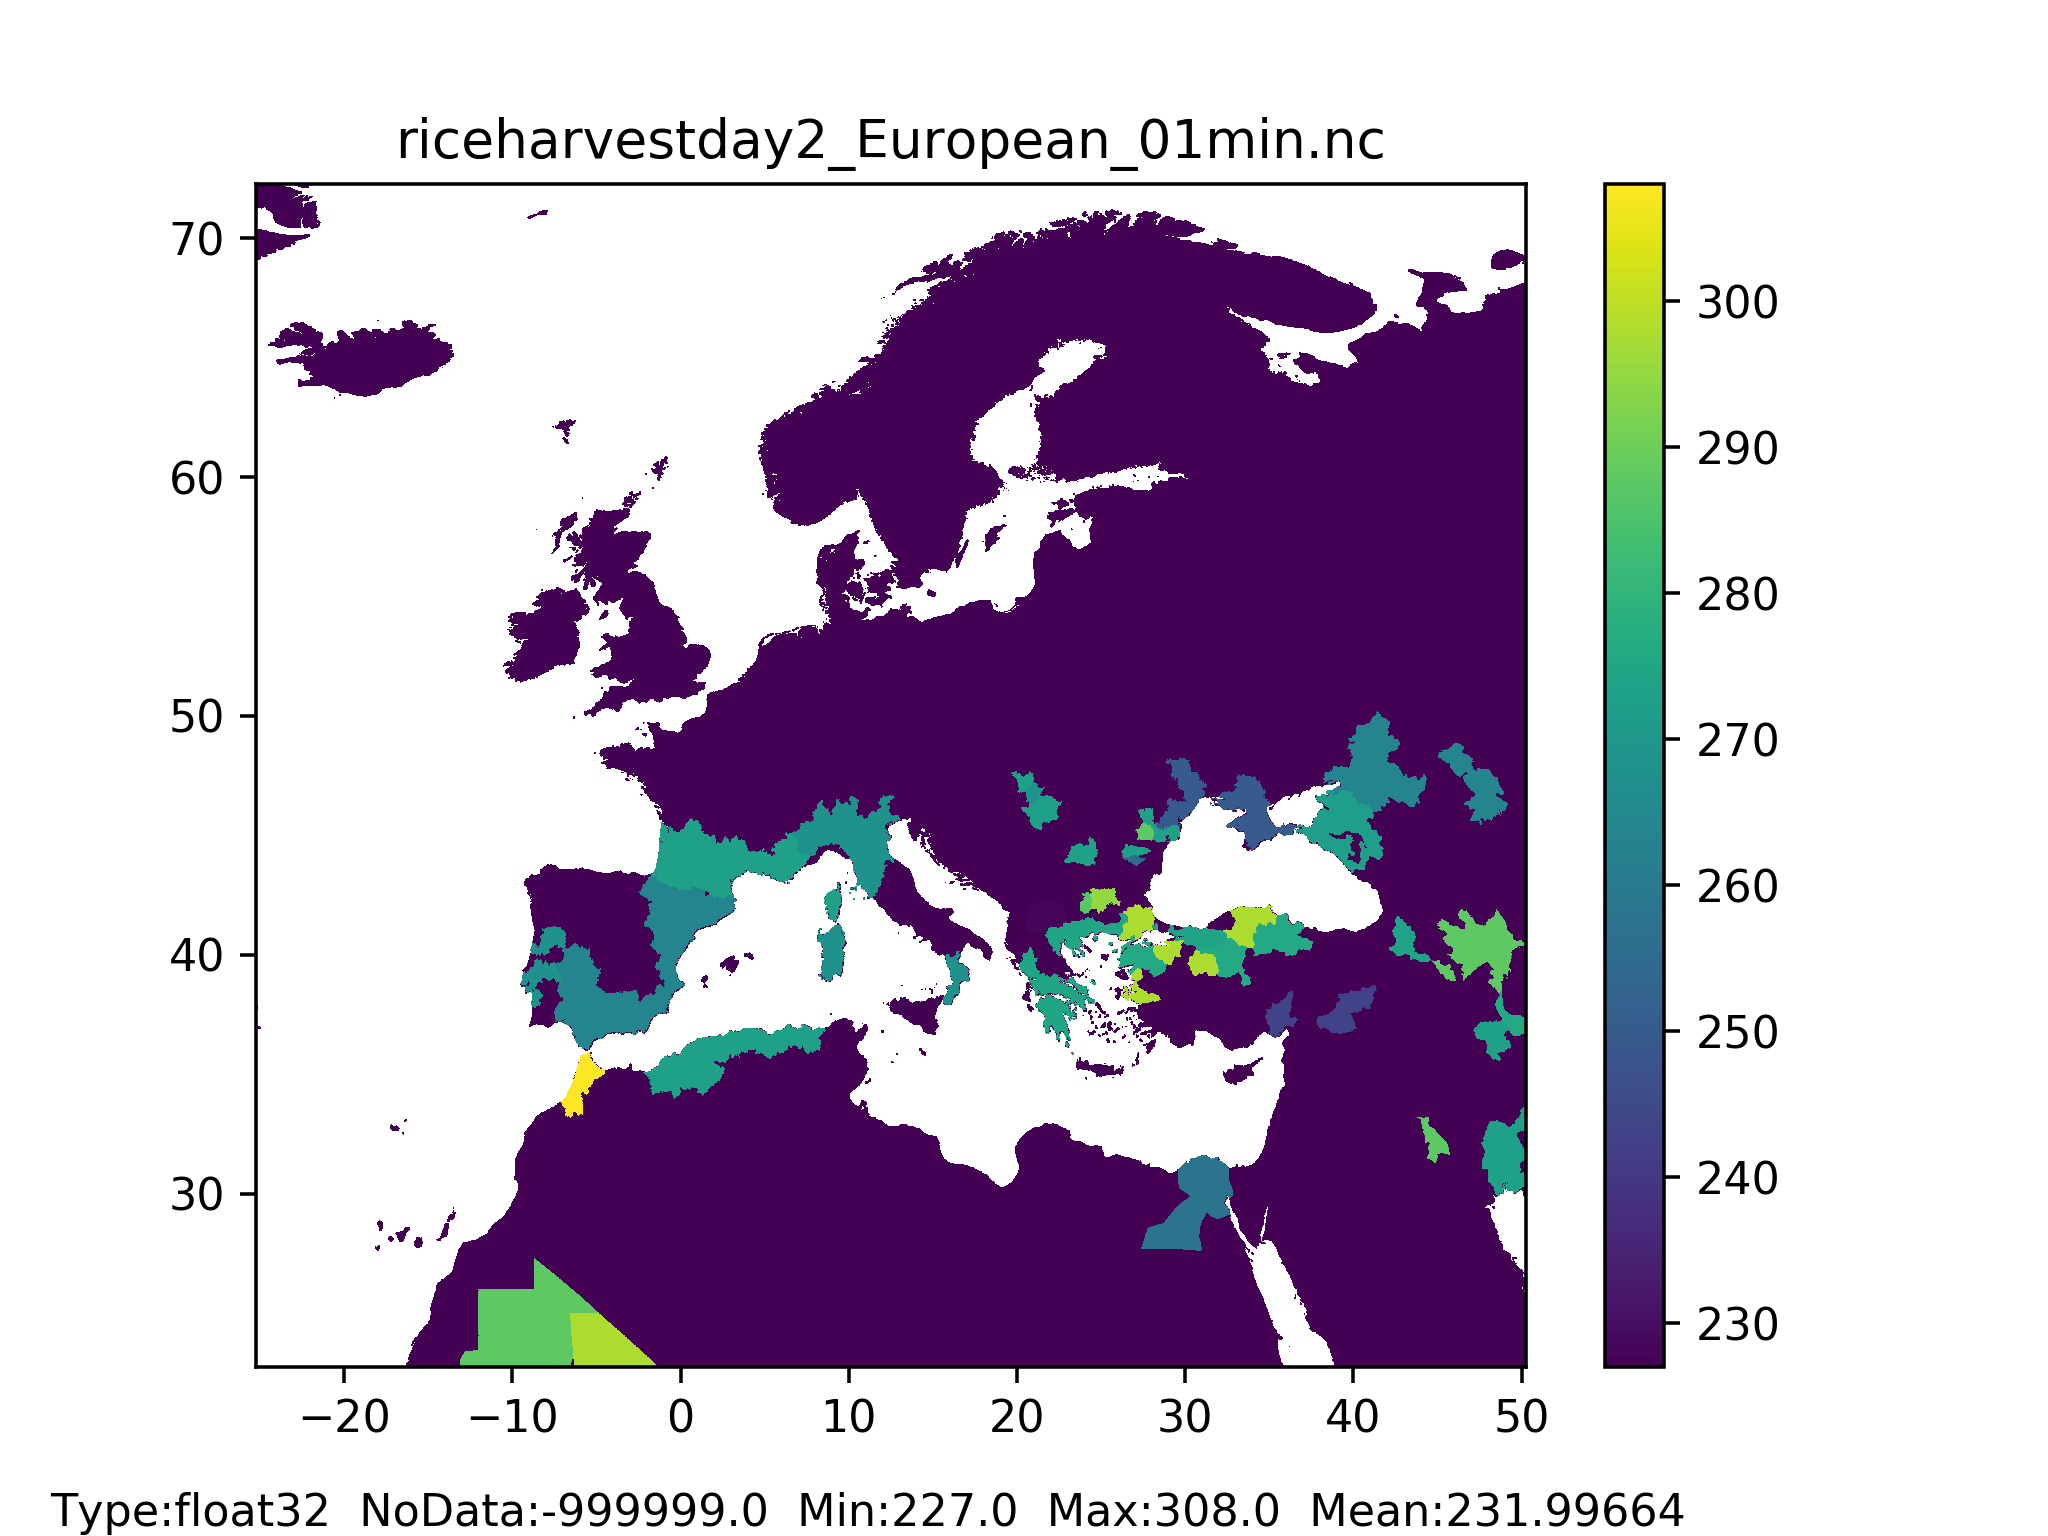
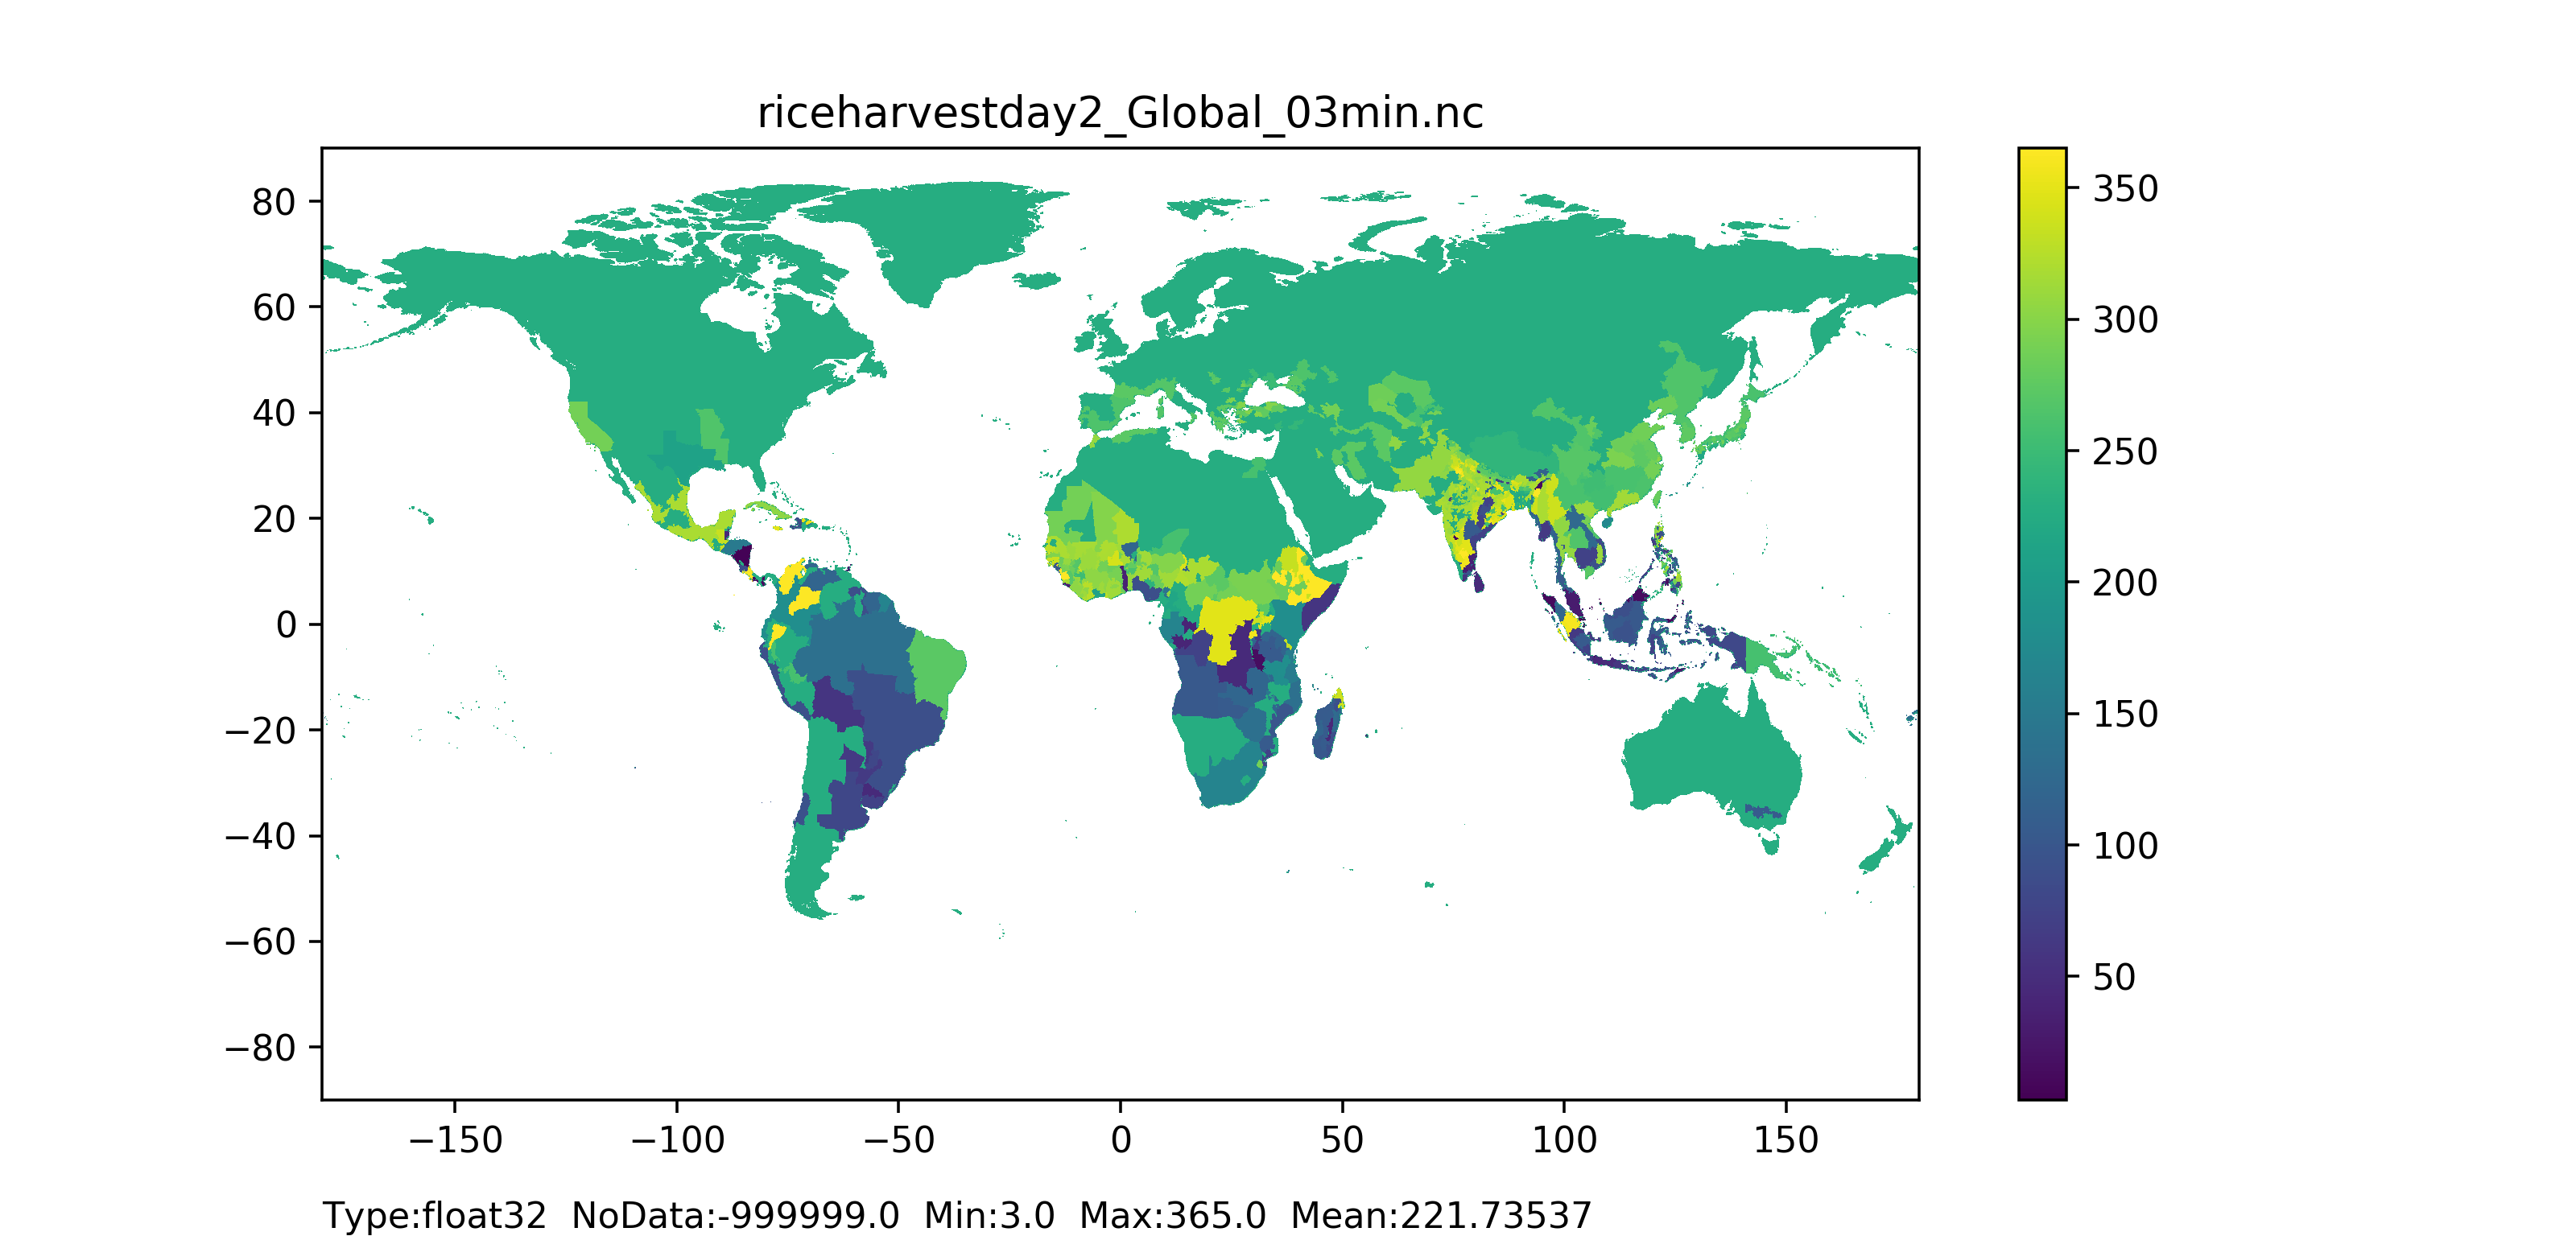
Figure 57: Rice harvest day 2 (season 2) map at 1 arc min horizontal resolution for European domain (left) and at 3 arc min horizontal resolution for Global domain (right).