## Water uptake by plant roots and transpiration
Water uptake and transpiration by vegetation and direct evaporation from the soil surface are modelled as two separate processes. This chapter describes the computation of the roots water uptake to support plant transpiration, the computation of direct evaporation from the soil surface is detailed in the next chapter.
The approach used in LISFLOOD for the computation of plan transpiration is based on the studies by Supit *et al*. (1994) and Supit & Van Der
Goot (2000). Specifically, the **maximum transpiration** per time step \[mm\] is given by:
$$
T_{max } = k_{crop} \cdot ET0 \cdot [1 - e^{( - \kappa_{gb} \cdot LAI)}] \cdot \Delta t - EW_{Int}
$$
where $k_{crop}$ is a crop coefficient, $ET0$ is the potential (reference) evapotranspiration rate $[\frac{mm}{day}]$, the constant $κ_{gb}$ is the extinction coefficient for global solar radiation \[-\], $LAI$ is the Leaf Area Index $[\frac{m^2}{m^2}]$, $EW_{Int}$ is the evaporation of intercepted water, and $\Delta t$ is the computational time step.
$k_{crop}$ is the ratio between the potential (reference) evapotranspiration rate and the potential evaporation rate of a specific crop; its value is 1 for most vegetation types, except for some highly transpiring crops like sugarcane or rice.
> Note that the energy that has already been 'consumed' for the evaporation of intercepted water is simply accounted for here by subtracting the evaporated water volume here ([EW_Int](../2_03_stdLISFLOOD_evaporation-intercepted-water/)). This is done in order to respect the overall energy balance.
The **actual transpiration rate** is reduced when the amount of moisture in the soil is small. In the model, a **water stress reduction factor** $R_{WS}$ [-] is applied to simulate this effect. $R_{WS}$ ranges between 0 (no transpiration, soil at wilting point) and 1 (no stress, soil moisture above the critical level):
$$
R_{WS} = \frac{w_t - w_{wp1}}{w_{crit1} -w_{wp1}}
$$
where $w_t$ is the amount of moisture in the superficial and upper soil layers $[mm]$, $w_{wp1} [mm]$ is the amount of soil moisture at wilting point (pF 4.2) and $w_{crit1} [mm]$ is the **critical amount of soil moisture** below which water uptake is reduced and plants start closing their stomata. The value $w_{crit1} [mm]$ depends on the soil and on the crop type, it is computed as follows:
$$
w_{crit1} = (1 - p) \cdot (w_{fc1} - w_{wp1}) + w_{wp1}
$$
where $w_{fc1} [mm]$ is the amount of soil moisture at field capacity, and $p$ is the soil water depletion fraction. Specifically, $p$ represents the fraction of soil moisture between $w_{fc1}$ and $w_{wp1}$ that can be extracted from the soil without reducing the transpiration rate. Its value is a function of both vegetation type and the potential evapotranspiration rate $ET0$. The vegetation type is defined using the crop group number ($CropGroupNum$) which is s an indicator of adaptation to dry climate.
LISFLOOD computes $p$ according to the procedure to estimate $p$ is described in detail in Supit & Van Der Goot (2003) and in Van Diepen *et al.* (1988):
- where $CropGroupNum \gt 2.5$:
$$
p= \frac{1}{0.76 + 1.5 \cdot min (0.1 \cdot ET0,1)} - 0.1 \cdot (5-CropGroupNum)
$$
- where $CropGroupNum \le 2.5$:
$$
p= p + \frac{min (0.1 \cdot ET0,1) - 0.6}{CropGroupNum \cdot (CropGroupNum+3)}
$$
$R_{WS}$ varies between 0 and 1. Negative values and values greater than 1 are truncated to 0 and 1, respectively. The following Figure illustrates the relation between $R_{WS}, w, w_{crit}, w_{wp}$:
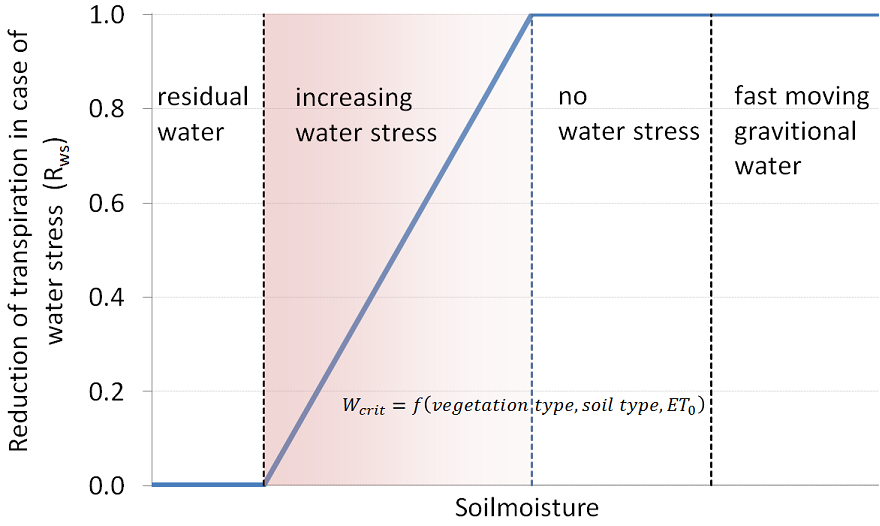
***Figure:*** *Reduction of transpiration in case of water stress.* $R_{WS}$ *is 1 when* $w \ge w_{crit}$, *it decreases linearly between* $w_{crit}$ *and* $w_{wp}$, *and it reaches zero when $w=w_{wp}$.*
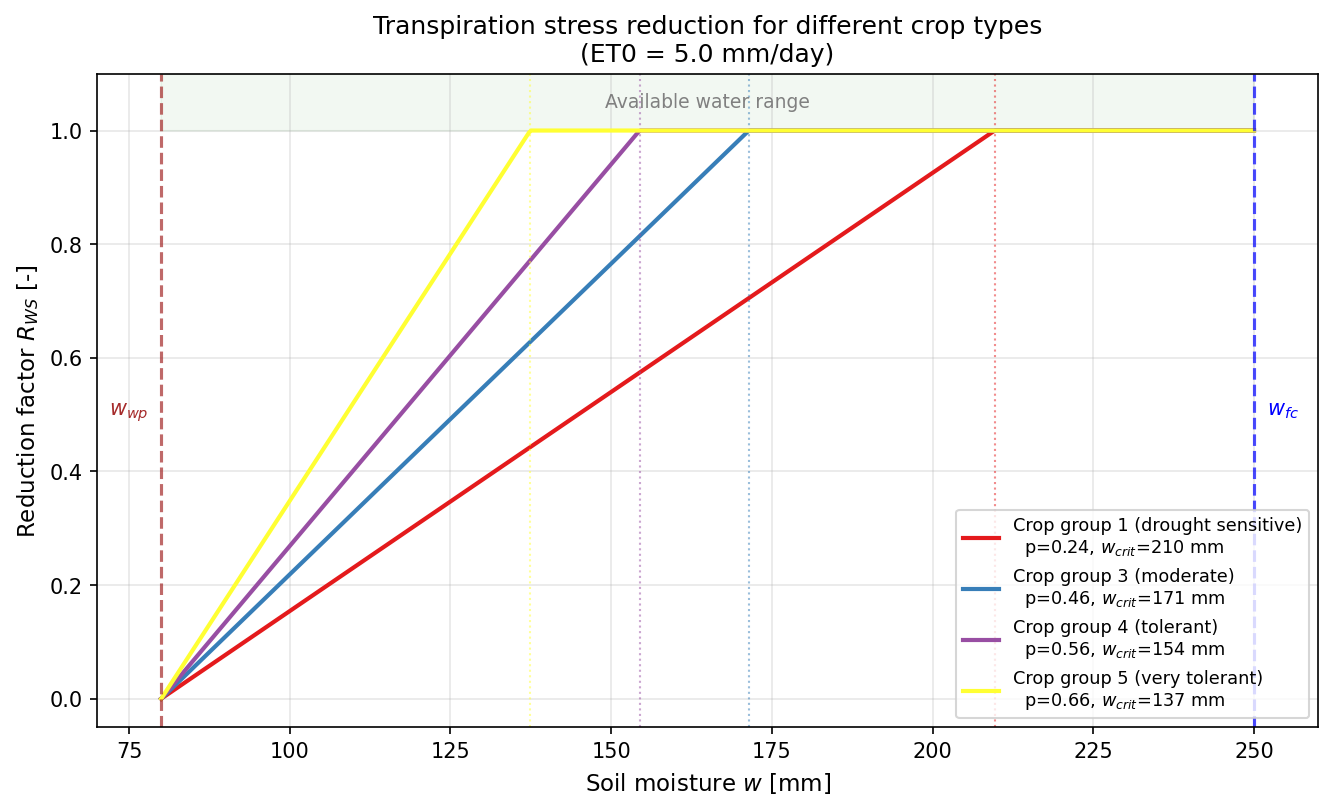 ***Figure:*** *Transpiration reduction factor $R_{WS}$ for different crop group numbers. Drought-sensitive crops (low CropGroupNum) have a higher $w_{crit}$ and start reducing transpiration earlier. Drought-tolerant crops (high CropGroupNum) can extract water to lower moisture levels before stress occurs.*
The **actual transpiration** $T_a$ is now calculated as:
$$
T_a = R_{WS} \cdot T_{max }
$$
with $T_a$ and $T_{max}$ in $[mm]$.
Transpiration is set to zero when the soil is frozen (i.e. when frost index *F* exceeds its critical threshold).
The amount of **moisture in the upper soil layer** is updated after computing the actual transpiration. Specifically, $T_a$ is first abstracted from the superficial soil layer 1 and then from the upper soil layer 2 under *not stressed* conditions (that is, the remaining amount of water in both the soil layers has to be larger or equal to the critical amount of soil mositure):
***Figure:*** *Transpiration reduction factor $R_{WS}$ for different crop group numbers. Drought-sensitive crops (low CropGroupNum) have a higher $w_{crit}$ and start reducing transpiration earlier. Drought-tolerant crops (high CropGroupNum) can extract water to lower moisture levels before stress occurs.*
The **actual transpiration** $T_a$ is now calculated as:
$$
T_a = R_{WS} \cdot T_{max }
$$
with $T_a$ and $T_{max}$ in $[mm]$.
Transpiration is set to zero when the soil is frozen (i.e. when frost index *F* exceeds its critical threshold).
The amount of **moisture in the upper soil layer** is updated after computing the actual transpiration. Specifically, $T_a$ is first abstracted from the superficial soil layer 1 and then from the upper soil layer 2 under *not stressed* conditions (that is, the remaining amount of water in both the soil layers has to be larger or equal to the critical amount of soil mositure):
$w_{AvNotStressed,1}=w_{1}-w_{crit,1} $
$w_{AvNotStressed,2}=w_{2}-w_{crit,2} $
$T_{a,1,Ns}= \min(T_a,w_{AvNotStressed,1}) $
If $T_{a,1,Ns} \lt T_a$ then $T_{a,2,Ns}= \min((T_a-T_{a,1,Ns}),w_{AvNotStressed,2})$.
The total amount of water supplied to the plants under *not stressed* conditions is then $T_{a,1,Ns} + T_{a,2,Ns}$, soil water depletion under *stressed* conditions occurs if $T_{a,s}=[T_{a,1,Ns} + T_{a,2,Ns}] \gt 0$. The distribution of water abstraction is then proportional to the water availability of each layer:
$w_{AvStressed,1}=w_{1}-T_{a,1,Ns}-w_{wp,1}$
$w_{AvStressed,2}=w_{2}-T_{b,2,Ns}-w_{wp,2}$
$w_{AvStressed,tot}=w_{AvStressed,1}+w_{AvStressed,2}$
$T_{a,1,s}= (\frac{w_{AvStressed,1}}{w_{AvStressed,1}+w_{AvStressed,2}})\cdot T_{a,s}$
$T_{a,2,s}= (\frac{w_{AvStressed,2}}{w_{AvStressed,1}+w_{AvStressed,2}})\cdot T_{a,s}$
Finally, the amount of water in the superficial and upper soil layers is updated as follows:
$w_{1} = w_{1} - T_{a,1,Ns} -T_{a,1,s}$
$w_{2} = w_{2} - T_{b,2,Ns} -T_{b,2,s}$
$w_t = w_{1} + w_{2}$
[🔝](#top)